Cryptocurrency
Mamoru Insider
Ready to uncover the best performing crypto tokens and hidden gems this week? Dive into Mamoru Insider's handpicked selection and expert analysis to...

Last week's drop in the cryptocurrency market, triggered by the insolvency of the US bank Silicon Valley Bank, has indeed been a dramatic event. Bitcoin's price plummeted to a low of $19,581, causing concern among investors and traders. However, this drop presented an opportunity for those who were able to buy in at the low point.
With Bitcoin now trading at $27,000, just a week later, investors who bought during the downturn have seen significant returns on their investment. This rapid recovery highlights the potential rewards associated with the high volatility of the cryptocurrency market. However, it is essential to keep in mind that this same volatility can also lead to losses, emphasizing the importance of risk management when participating in crypto trading and investing.
As always, it is crucial for investors to conduct thorough research, assess their risk tolerance, and stay informed about market conditions before making any investment decisions. The unpredictable nature of the cryptocurrency market can offer substantial gains, but it can also present substantial risks.
For the first time since falling below it in June 2022, BTC has the opportunity to close a weekly candle above the 200-week EMA.
BTC will close above the 200-week moving average if it closes above $25,219 this Sunday, 3/19/2023 by 0:00 UTC.
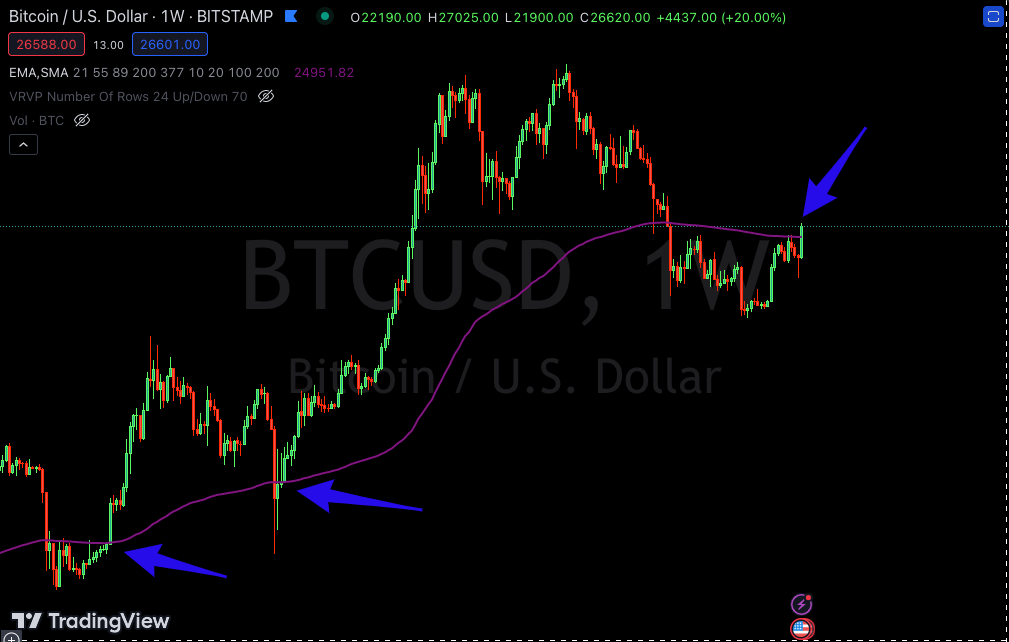
The last time this happened was around the lows of March 2020. This was the very begging of Bitcoin's rally from $6k to $69k.
Keep in mind that this price action does not always mean the rally goes to new all-time highs. It does however suggest that the rally could continue in the medium term.
Bitcoin closed a weekly candle above the 200-week MA in April 2019, before rallying from $4k to $14k.
Based on a few historic trends, this could be a situation to monitor.
The Bitcoin Fear and Greed Index is a measure of market sentiment in relation to Bitcoin — on a scale of 1–100.
Despite more than a 30% rally since last Friday, the index is still printing a neutral reading.

The fear & greed index is not an indicator that traders should rely on solely to make trading decisions however, combined with other confirmations, it can provide valuable insight on market sentiment. How does the fear & greed index work? It aggregates a number of different indicators, such as social media content and recent market volatility, to give a snapshot of the global Bitcoin economy. Using the tool provides valuable insight, separating emotion from fact and even identifying trading opportunities as a result.
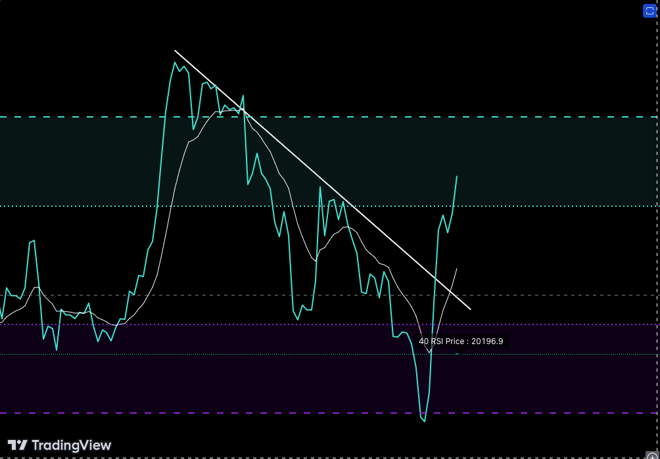
Next, let's look at Oscillators. Oscillators are momentum indicators that measure whether an asset is overbought or oversold relative to its recent price history. The Relative Strength Index (RSI) is one of the most popular oscillators used by traders and investors alike.
During all of January, we saw the BTC RSI remain above 70 for extended periods of time, indicating that Bitcoin was in an overbought state.
February saw a cooldown in the RSI as BTC has slowly worked its way back down to the neutral zone. It is hard to say whether it goes lower from here or not.
On Sunday, March 12, the RSI broke a 2-month trend line to the upside. This came after several rejections of the trend line since the RSI began falling on January 14th.
As the RSI works its way into the bullish control zone (above 70) we could see a sustained rally in the coming week.
Finally, let's look at Pivots Points (PP). PP are support and resistance levels derived from previous trading sessions' high, low, and closing prices. Over the past week, we've seen Bitcoin flip $25,000 from a resistance price to support.
Overall, it appears that technical analysis paints a short term bullish picture for Bitcoin over the next few weeks. As long as key support levels hold up and Bitcoin consolidates, we could see another strong leg up to $28k-$30k next week.
If BTC falls back below the $25,319 level, this rally probably won't be sustained, and we can start to talk about a bull trap.
Of course, no one can predict with certainty what will happen next, but understanding how technical analysis works can help you make more informed decisions when trading or investing in cryptocurrencies like Bitcoin.
Disclaimer:
The information provided on this website does not constitute investment advice, financial advice, trading advice, or any other sort of advice, and you should not treat any of the website's content as such. We do not recommend that any cryptocurrency should be bought, sold, or held by you. Do conduct your own due diligence and consult your financial advisor before making any investment decisions.
Ready to uncover the best performing crypto tokens and hidden gems this week? Dive into Mamoru Insider's handpicked selection and expert analysis to...
Update: Funds on our platform have not been affected by recent developments involving Silvergate Capital Corporation (NYSE: SI), Signature Financial...
Bitcoin Surges by Nearly 20% as U.S. Bank Stocks Halt Trading: Analysts Anticipate Further Price Volatility